ACPSsquarelogo

If you have not yet taken the survey on their daily e-Newsletter called ACPS Daily Digest, Alexandria City Public Schools (ACPS) are taking submissions through Wednesday, Jan. 14. All comments are welcome, including from those who may not read the Daily Digest.

The survey is available online at this link.

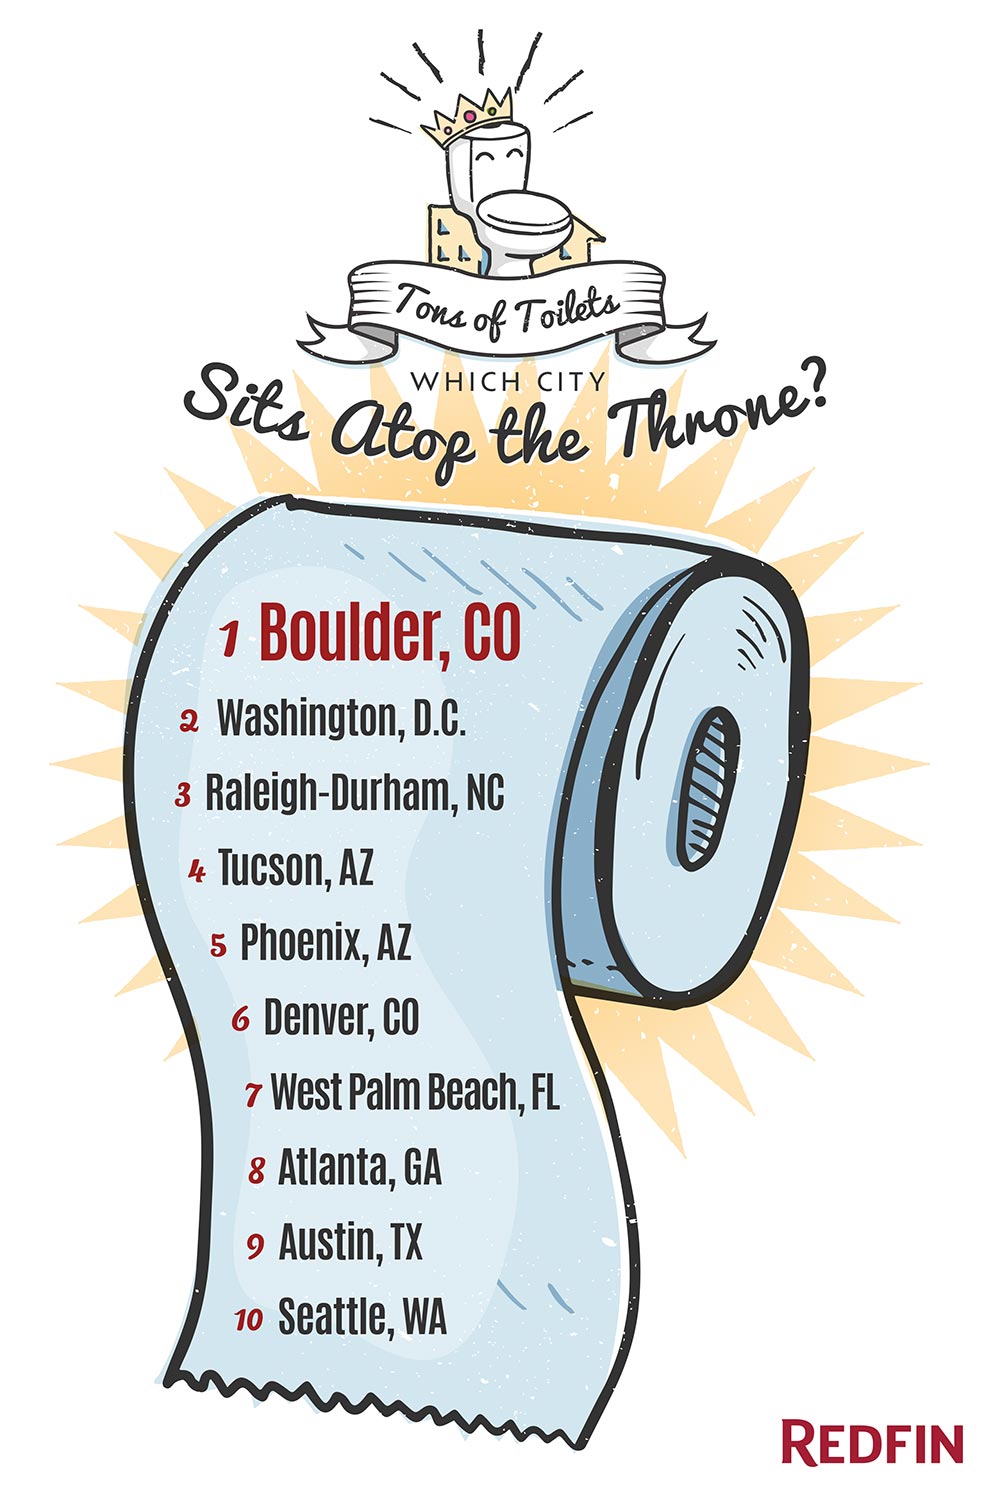
Who would have guessed that Washington, DC ranks #2 in the nation when it comes to number of residential toilets per capita (insert joke here…)? According to a report from Redfin real estate brokerage, there are 98 loos for every 100 people in the DC metro area. DC was topped only by Boulder Colorado, which leads the nation with an estimated 102 toilets per resident.

DC ranks third, behind LA and Chicago, in terms of water consumption based on a day’s worth of flushes. 144.8 Olympic-sized swimming pools could be filled with the water used in a day’s worth of flushes in the DC area.

Bathrooms are serious business when it comes to the home search. DC Agent Leslie White explains, “It’s definitely a consumer-driven trend. I don’t know when it took place, but having a master bathroom off the main bedroom is now seen as a requirement, whereas years ago, it was considered a luxury. I’ve toured lovely 100-year-old row houses, but if there’s only one bathroom for the three bedrooms on the top floor, my clients’ faces fall. They need that extra bathroom.”

Redfin real estate brokerage arrived at this list by looking at the most recent household and population data from the American Community Survey, along with county recorder data about the number of toilets present in each residence.

PR_Tons-of-Toilets_list_2014-09-30

(PR Web) Drivers from Idaho, Washington, D.C., and New York have been judged to be the rudest drivers, according to a survey by Insure.com, an independent consumer insurance information website.

Also judged to be quite rude are drivers from Wyoming, Massachusetts, Vermont and Delaware.

Here’s how the top 10 rudest drivers rank, based on a survey of 2,000 licensed drivers nationwide:

  1. Idaho
  2. Washington, D.C.
  3. New York
  4. Wyoming
  5. Massachusetts
  6. Vermont (tie)
  7. Delaware (tie)
  8. New Jersey
  9. Nevada
  10. Utah

See the rankings for all states at this link.

Virginia new sign.jpg

After receiving a B- two years ago, Virginia received an A- e.Republic’s 2014 Digital States Survey. Check out the infographic at this link.

Via Virginia Business

e.Republic’s Center for Digital Government assigned each state a grade based on quantifiable results in better serving citizens and streamlining operations. Criteria included actions supporting state priorities and policies to improve operations or services, hard- and soft-dollar savings/benefits and innovative solutions.

Since the last survey in 2012, grades improved in 21 states, declined in 12 and stayed the same in 17. In 2014, Virginia earned an A- along with Connecticut, Georgia, Ohio and Pennsylvania. Michigan, Missouri and Utah received A grades.

The survey highlighted Gov. Terry McAuliffe’s creation of Cyber Virginia and the Cyber Security Commission and its new open data portal which promotes “transparent, data-driven decision-making.”

The Center for Digital Government is a government research and advisory institute on information technology policies and best practices in state and local government. It is a division of e.Republic, a Folsom, Calif.-based media and research company focused on state and local government and education.

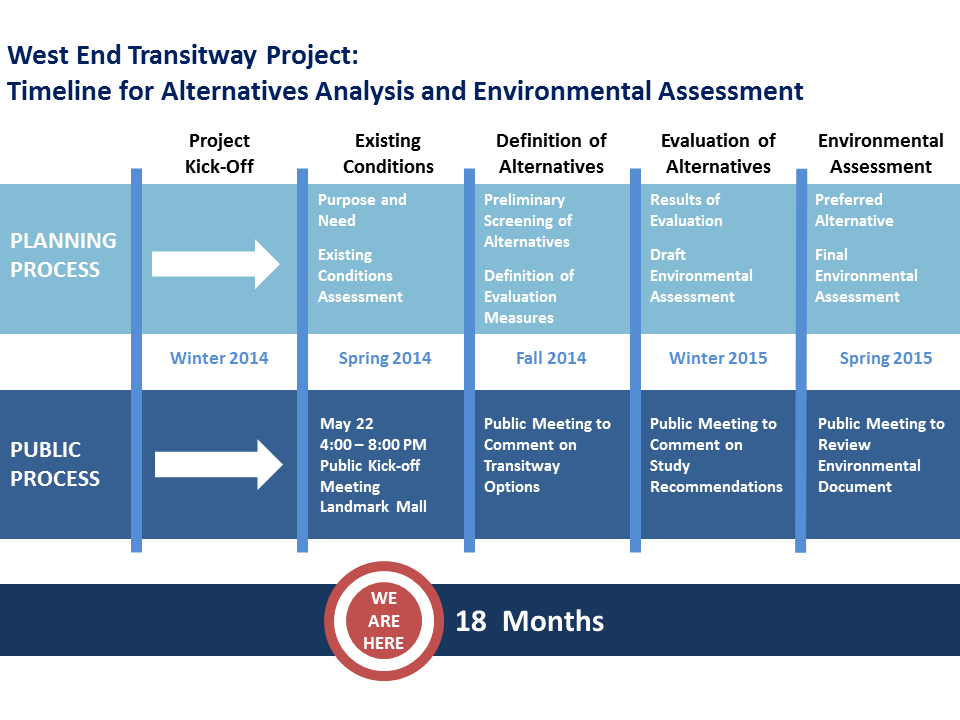
West End Transitway Timeline Alexandria, Virginia

The initial phase of Public Outreach for the West End Transitway Alternatives Analysis / Environmental Assessment (AA/EA) is almost over. Please take this opportunity to take the Survey by clicking on this link.

The survey will close on July 31, 2014. However, there will be many more opportunities to participate throughout the AA/EA process. Please visit the West End Transitway project website regularly for up-to-date project and meeting information.

If you have any questions or need additional information, please contact Allan Fye, Principal Planner or 703-746-4151.

Virginia

Thumbtack.com, in partnership with the Ewing Marion Kauffman Foundation, has released the results from the third annual Thumbtack.com Small Business Friendliness Survey. The study, drawing upon data from over 12,000 small business owners, provides new insights into state and local business environments across the nation.

“Creating a business climate that is welcoming to small, dynamic businesses is more important than ever, but rarely does anyone ask small business owners themselves about what makes for a pro-entrepreneur environment,” says Jon Lieber, Chief Economist of Thumbtack. “Thousands of small business owners across the country told us that the keys to a pro-growth environment are ease of compliance with tax and regulatory systems and helpful training programs.”

Some of the survey’s key findings include:

  • Utah, Idaho, Texas, Virginia and Louisiana gave their states the highest rating for friendliness to small business. Small businesses in Colorado Springs, Boise and Houston gave their cities the highest ratings.
  • In contrast, small business owners gave California, Rhode Island and Illinois an “F,” while Connecticut and New Jersey both earned a “D” grade. Sacramento, Providence and Buffalo were the survey’s worst-performing cities as rated by their small business owners.
  • Small businesses in Texas, Utah and Idaho have rated their states in the top five every year this survey has run, while California and Rhode Island have been rated in the bottom five every year.
  • The friendliness of professional licensing requirements was the most important regulatory issue in determining a state’s overall friendliness to small businesses. Closely following licensing requirements was the ease of filing taxes.
  • Once again, tax rates was a less important factor than the ease of regulatory compliance in determining the overall friendliness score of a jurisdiction. Two-thirds of respondents said they paid their “fair share” of taxes – that is, they felt like they were neither under-paying nor over-paying.
  • Small business owners who were aware of training programs offered by their government were significantly more likely to say their government was friendly to small business than those who weren’t. Awareness of training programs raised overall scores by 10 percent, while 76 percent of those who said they were aware of government-sponsored training programs for business owners ranked their local government as “somewhat” or “very supportive,” and only 8 percent of these said local government was unsupportive.

“It is critical to the economic health of every city and state to create an entrepreneur-friendly environment,” said Dane Stangler, vice president of Research and Policy at the Kauffman Foundation. “Policymakers put themselves in the best position to encourage sustainable growth and long-term prosperity by listening to the voices of small business owners themselves.”

A copy of the survey’s full methodology and analysis paper is available upon request. Please email Thumbtack’s Chief Economist, Jon Lieber, for a copy of the paper and with any questions or comments you might have.